Program has ability to display plots of energy and other quantities from calculations that produce multiple structures among their results (Gaussian output, ADF output, Vasprun.xml, etc.).
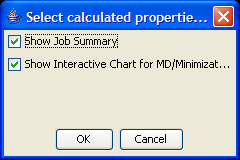
If input data has multiple structures (minimization, MD) one needs to select corresponding checkbox in dialog below to display plots of energy and other quantities from calculations
Each structure/snapshot could have several quantities - energy, gradients, etc. Available quantities are shown in dialog:
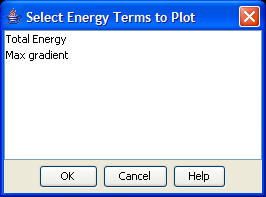
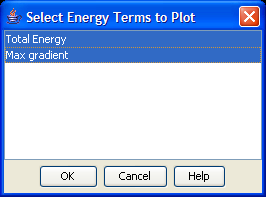
Use mouse to select ONLY ONE quantity to chart. To select multiple terms use mouse while holding down Shift or Ctrl key.
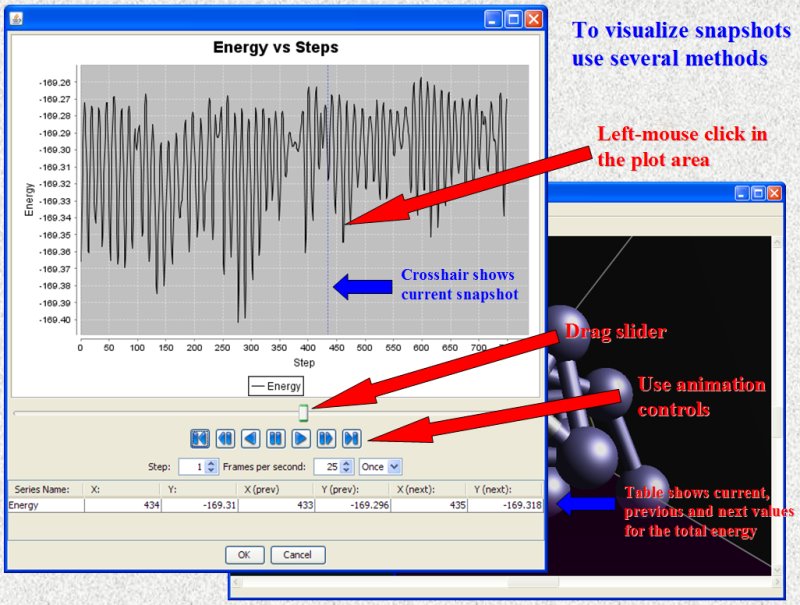
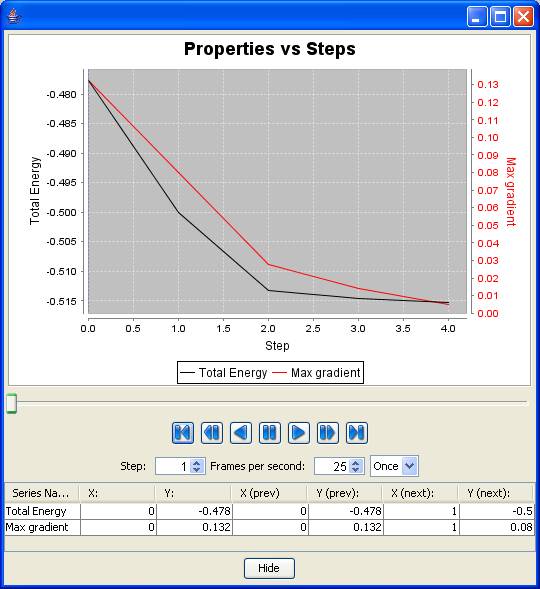
Available controls for interactive charting are presented below
Selection of multiple terms produces a chart with several Y axes
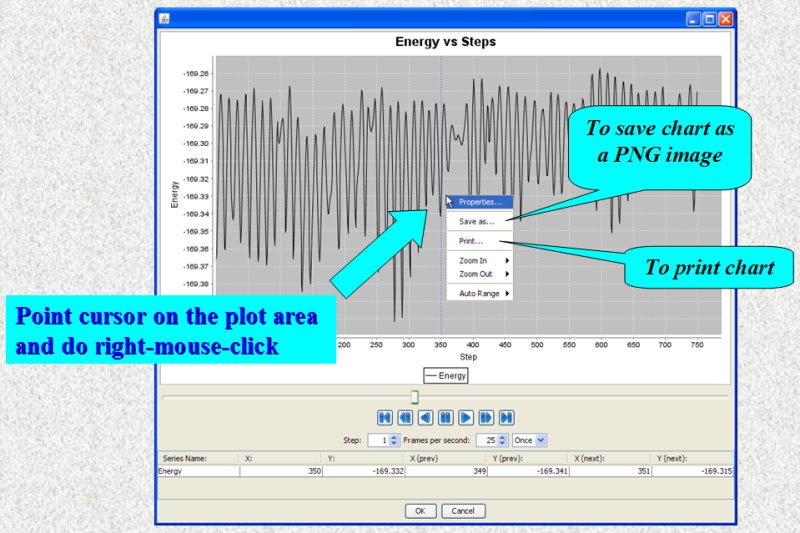
It is easy to save chart as PNG image or print it.
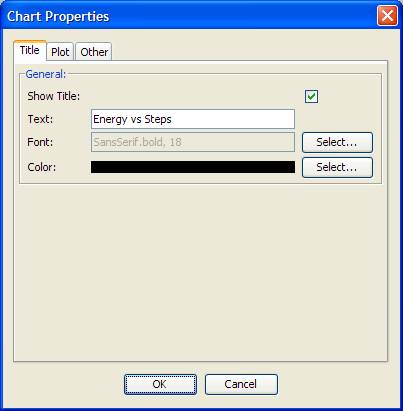
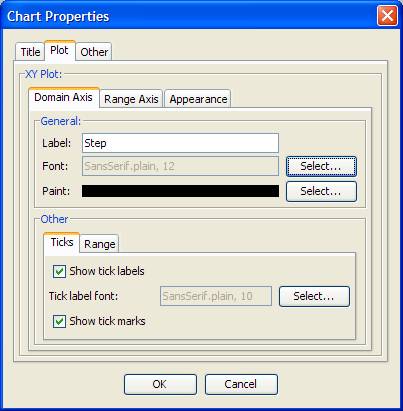
Using Chart Properties dialog user can change title, label and other properties of the chart:
Send all questions, suggestions and comments to Vlad (vvv900@gmail.com)
Dr. Vladislav Vasilyev
Supercomputer Facility,
The Australian National University,
Canberra, ACT, 0200, Australia
[Index]