After running dynamics for 10000000 steps we have (very) large files, decapeptide-md.out (~42 Mb), which contains energies, and decapeptide-md.mdcrd (~33 Mb) containing snapshots of atomic coordinates along the trajectory.
mdout file contains energy decomposition for each MD step in the form:
 NSTEP =      700   TIME(PS) =       1.400  TEMP(K) =   271.82  PRESS =     0.0
 Etot   =       142.7453  EKtot   =       130.4500  EPtot      =        12.2952
 BOND   =        58.4024  ANGLE   =        66.9022  DIHED      =        83.3345
 1-4 NB =        34.7940  1-4 EEL =       546.6874  VDWAALS    =       -31.2746
 EELEC  =      -648.3911  EGB     =       -98.1597  RESTRAINT  =         0.0000
 ------------------------------------------------------------------------------
To plot the energies we need to pull them out from the mdout file. Amber developpers suggest to use a perl script, process_mdout.perl, to do so. Since process_mdout.perl generates a lot of files it's better to run it in separate directory:
mkdir analysis
cd analysis
../process_mdout.perl ../decapeptide-md.out
A script will create a whole series, leading off with the prefix "summary." such as "summary.EPTOT", of output files. These files are just columns of the time vs. the value for each of the energy components:
Starting output...
Outputing summary.TEMP
Outputing summary_avg.TEMP
Outputing summary_rms.TEMP
Outputing summary.TSOLUTE
Outputing summary_avg.TSOLUTE
Outputing summary_rms.TSOLUTE
Outputing summary.TSOLVENT
Outputing summary_avg.TSOLVENT
Outputing summary_rms.TSOLVENT
Outputing summary.PRES
Outputing summary_avg.PRES
Outputing summary_rms.PRES
Outputing summary.EKCMT
Outputing summary_avg.EKCMT
Outputing summary_rms.EKCMT
Outputing summary.ETOT
Outputing summary_avg.ETOT
Outputing summary_rms.ETOT
Outputing summary.EKTOT
Outputing summary_avg.EKTOT
Outputing summary_rms.EKTOT
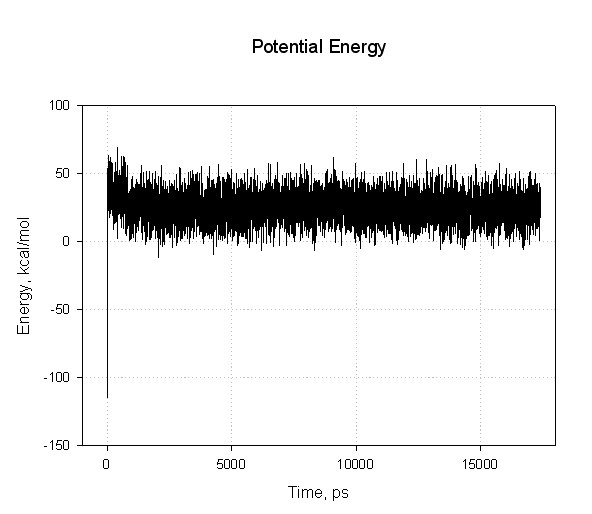
Outputing summary.EPTOT
Outputing summary_avg.EPTOT
Outputing summary_rms.EPTOT
Outputing summary.DENSITY
Outputing summary_avg.DENSITY
Outputing summary_rms.DENSITY
Outputing summary.VOLUME
Outputing summary_avg.VOLUME
Outputing summary_rms.VOLUME
You can plot the summary files with your favourite graphing program.
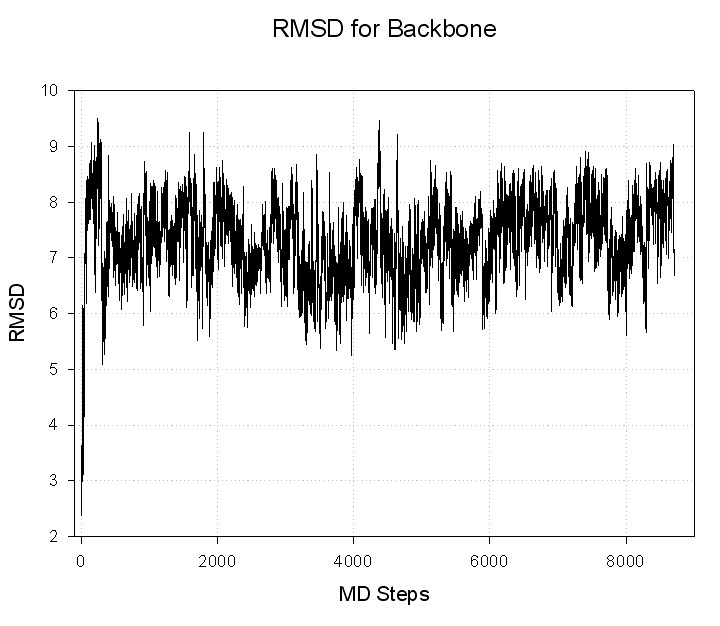
Input file for ptraj (rmsd.in):
trajin decapeptide-md.mdcrd
reference decapeptide-min.rst
rms reference out decapeptide-backbone.rms
Command to run ptraj;
ptraj decapeptide.top < rmsd.in
Resulting file with RMSD: decapeptide-backbone.rms
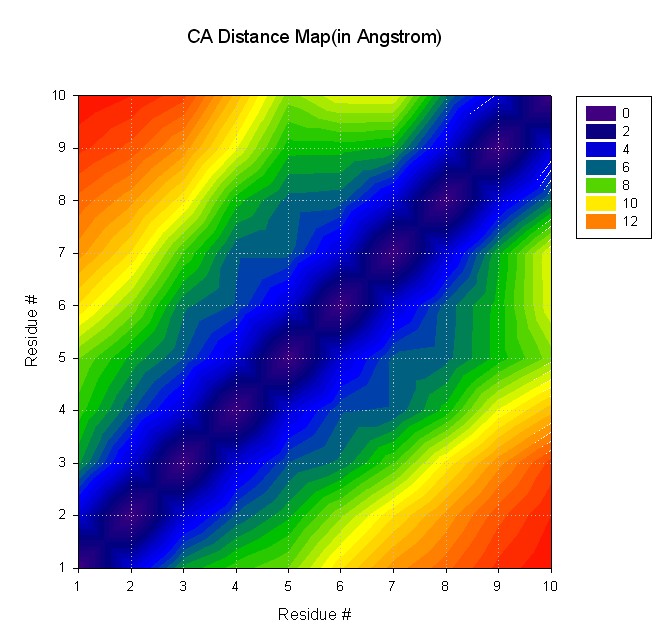
Input file for ptraj (distmat.in):
trajin decapeptide-md.mdcrd
matrix dist @CA out distmat.dat
Command to run ptraj;
ptraj decapeptide.top <distmat.in
Resulting file with distance map: distmat.dat